We didn't find any errors and your message was successfully sent! Someone will be in touch with you shortly.
August 25, 2017
I remember, just 5 or 6 years ago, when the Google Analytics dashboard housed only a handful of options to track and monitor a site. But boy has it grown in the last few years. Making this dashboard one of the more confusing to read and analyze for both business owners and advertising agencies alike.
So much so, that Google Analytics now comes with a Certification class and testing. For those novice users, instructional videos are housed directly at the top of every page in Google Analytics with content matching what information is on that page. Creating an easier user experience for those in need of a little guidance when it comes time to check out their bounce rates or time on site.
Lucky for us, Google has created an effortless way to set up, customize and share a Google Analytics customized dashboard. Let’s look at how we can make our analytics lives a little easier!
Super easy, just open Reports, Click on CUSTOMIZATION > Dashboards, and then click on +New Dashboard.
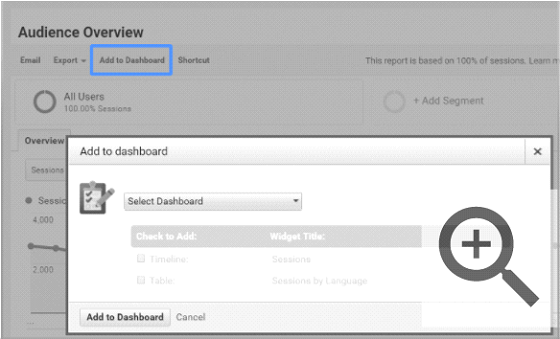
You will notice at the top of each reports page there is an option to “Add to Dashboard”. This will add that specific report to your customized Dashboards. From this screen, you can select which dashboard you would like to add the information to.
There’s also an add widgets tool in the dashboard itself. So, you can add reports in that way, as well.
So, by now you should be wondering which reports you should add to your dashboard that would be helpful?
Here are some of my top favorites and suggestions:
But use what options and reports makes sense for you and matches your online and offline KPIs.
Make sure you share your lovely new dashboard with the rest of the team, your agency and your digital strategist. Here’s how: At the top of the dashboard select Share, and Share in Solutions Gallery and complete the options.
Viola! Easy to manage Google Analytics!